


Todd Whitehead
April 20, 2022
Synergy Sports is working on a new metric to help coaches and scouts develop winning team strategies. Before it gets here – let’s talk about how it works.
Basketball is a game of inches. A launch angle tilted one degree in the wrong direction is all that separates a swish from a miss, brick from bucket, cash from clank. What I’m saying is that not all misses are bad shots (and not all makes are good ones, either). Over a short period of time – the span of a quarter, a game, even a tournament – the shots may fall, or they may not. Those are just the breaks of the game.
So, rather than getting distracted by short-term shooting results we should be paying attention to the process! Are we getting our shooters good looks? Are we forcing the other team to take tough ones? This is the fundamental tug-of-war at the heart of every basketball game.
Our new metric, Synergy Shot Quality (“SSQ” for short), gives coaches and scouts an objective way to evaluate the quality of each shot. Last season in Division I, the average shot yielded almost exactly 1 point – the equivalent of 50% shooting on 2-pointers or 33% shooting on threes – with the most difficult shots (like half-court heaves) yielding close to nothing and the easiest ones (like wide-open dunks) generating up to 2 points each. Correspondingly, SSQ spans the same range – from roughly 0 to 2 points per shot with an average of 1.00. The goal of our SSQ model, then, is to use the contextual information that Synergy collects about every play we watch to determine the probability that a league-average shooter would make a shot in the same situation, to find where on that spectrum of value each shot is expected to fall.
We are using a flexible, data-driven modeling approach that allows us to sift through the vast amount of data that we collect to find the factors that are most important in determining shot quality. For each type of shot – jumper, layup, dunk, hook, runner, and tip – the model looks at the recent history of shots and it draws connections between shot features and shot results. Using this approach, the factors we found to be most strongly linked to shot quality were shot distance, defensive pressure, play type, shot clock, and the way that the possession started.
Warning: this next paragraph is going to get a little nerdy. If you’re not interested in hearing any technical details, just skip ahead to the next section now.
[With robot voice]: To model shot quality we used logistic regression. A separate model was created for each league and for each type of shot. Models were trained on the previous season of data. We used cross validation to identify the most important features to include in each model.
Phew. That’s over. Now let’s look at how exactly each feature in the model is related to shot quality.
Shot Distance
The relationship between shot location and shot quality is a familiar one. Generally, the further you stand from the hoop, the more difficult it becomes to make a shot. As a result, distance emerges from the data as a feature that is obviously an important determinant of SSQ for any type of shot.
Distance is a big factor. pic.twitter.com/nzg1dwTTaF
— Todd Whitehead (@CrumpledJumper) April 20, 2022
Defensive Pressure
Likewise, we know that the degree of defensive pressure a shooter is facing can make his shot more or less difficult to convert. A shooter is more likely to make a wide-open shot than a closely contested one from the same location (everything else being equal). For each catch-and-shoot jumper (which, taken together, comprise 30% of all FGA in NCAA Division I this year), our loggers note whether the shot was guarded or unguarded and this tagging helps inform the shot quality estimate.
Defense has an impact. pic.twitter.com/zsOZ79UCIO
— Todd Whitehead (@CrumpledJumper) April 20, 2022
Play Type
We also categorize each scoring chance as one of 11 different types of plays. These play type designations hold additional clues about the presence of defenders near the shooter. Actions like post-ups and isolations, by definition, will have a defender in the picture, whereas spot-ups and pick-and-pop scoring opportunities tend to be the result of a shooter finding some extra space away from defenders. Consequently, point-per-shot averages differ by play type, even for otherwise similar types of shots. Foul line jumpers created by a post-up move tend to go in the basket less often than foul line jumpers created by a pick and a pop (because those pesky post defenders tend to get in the way!), so the model accounts for the play type when estimating the quality of each shot.
The Play Type is part of the equation. pic.twitter.com/G4CDNWqqQp
— Todd Whitehead (@CrumpledJumper) April 20, 2022
Shot Clock
There are additional factors that impact shot quality which we do *NOT* routinely collect as part of the logging process. Were the shooters feet set? Were his shoulders squared to the hoop? Did he take the shot in rhythm with his typical release? The model doesn’t “know” any of these details, but we feed it related information that can provide some hints about how the shooter might have been set up to take the shot. We record, for example, whether each jumper was a catch-and-shoot opportunity or something that came off the dribble. Unguarded catch-and-shoot jumpers are usually a shooter’s best opportunity to take an unimpacted shot with his preferred shooting motion, so they tend to go in more often than off-the-dribble jumpers.
Similarly, there are specific situations that tend to result in lower quality shots. When the shot clock is running low, we tend to settle for any shot we can get. That might mean a quicker-than-normal shot release, a player taking a shot outside of their normal comfort range, or an off-balance shot after an off-target pass. These mishaps don’t always happen in short clock situations, but they become more common when the option of ‘swing the ball for a better shot’ is no longer available. As a result, the model dings shots taken with a short clock (ie. shots taken with less than 5 seconds remaining).
Short shot clock situations get dinged. pic.twitter.com/CpHJQH2K4S
— Todd Whitehead (@CrumpledJumper) April 20, 2022
Start of Possession
In some cases, the start of a possession has a big impact on the quality of the shot at the end of the possession. Plays that start with a live-ball turnover tend to lead to those fast break chances – the 3 on 2, 2 on 1, 1 on 0 breaks – that produce the juiciest looks. This is especially true of plays that end with a dunk or layup. A layup in transition after a steal tends to be converted more often than, for example, a layup in isolation after a made basket; the former is more likely to be taken with a numerical advantage whereas the latter is more likely to require the shooter to beat a set defense.
The way the play starts can be important too. pic.twitter.com/KlRfeNphlZ
— Todd Whitehead (@CrumpledJumper) April 20, 2022
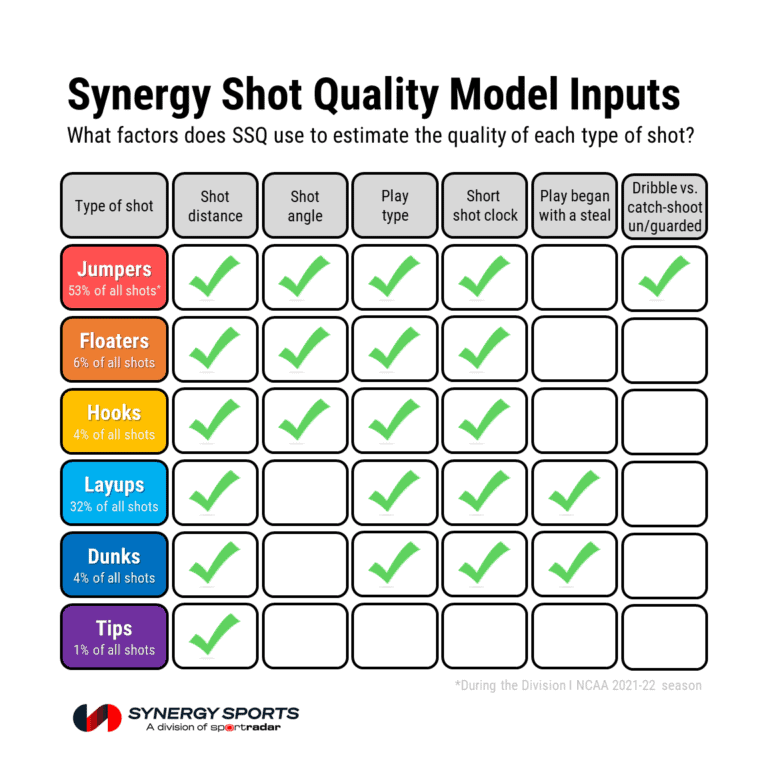
Our logging system is designed to collect as much information as we can in an efficient way; so, we have different amounts of information to describe different types of shots. For example, each jumper is catalogued with a lot more detail than each tip shot. As a result, the model uses more information to estimate SSQ for a jumper than it does for a tip shot. Here’s a summary of the information that the SSQ model uses to estimate the quality of each type of shot.
There was additional contextual information that we left out of the model, on purpose. Some pieces of data – like whether a 3-point jumper came from the right wing or the left wing – just wasn’t very informative. This type of information wouldn’t be helpful in estimating the quality of a new shot. Some other shot qualifiers had the potential to be informative, but they happened too infrequently for us to be sure – like trying to judge the quality of a tip shot attempted by the roll man vs. one attempted by a cutter when neither event occurred more than a hundred times across Division I last season.
There are a lot of other game-level factors – like the time remaining in the game, the score margin, the location of the game, and the quality of the opponent – that we chose not to include in the model. While we acknowledge that these factors are important and understand that they would help us to predict the probability of a made shot, we believe these game-level factors should be considered separately from the concept of shot quality. Of course, a coach could still check to see if her team was getting high quality looks at the end of close games, for example, or evaluate whether they were preventing opposing teams from having easy shots on the road – by using the filtration tools in the Synergy Advanced Analytics app.
The biggest piece of information that we are choosing to leave out of the shot quality model is the identity of the shooter. The model aims to determine the probability that an average shooter facing the same situation would have made a particular shot. In other words, we have tried to describe the quality of each shot in a generic way, ignoring the shooting skill of the individual player.
A second metric that we’re calling Synergy Shot Making (or just “SSM” for short) tells us how much an individual shooter (or team) has exceeded the expectations of the SSQ model, it is our measure of shooting skill. We calculate SSM as the difference between observed shooting percentages and shot quality (ie. SSM = points-per-shot minus expected points-per-shot). Players who make more shots than would be expected based on the difficulty of their attempts will have high SSM scores. Here’s a look at the best shot maker in each zone over the last five NBA seasons.

We’re hoping SSQ (and SSM) will be useful for post-game reports, pre-game opponent scouting, prospect evaluation and lots of other applications. And we’ll have more to say about how, specifically, coaches and scouts might use these new metrics to develop winning team strategies in future posts, so check back here soon!
The development of the Synergy Shot Quality and Synergy Shot Making metrics was led by Alexander Ekkel. Alex is building tools to help coaches, scouts, and players find winning team strategies as part of Synergy’s Analytics and Insights Team.