


Todd Whitehead
December 29, 2021
NBA heat maps by play type
Tracking 10-year league trends in shot locations for different types of plays.
If you’re reading this, you’ve probably already heard the news: “The game has changed.” The midrange game is dead; three-pointers killed it.
Well, unless, that is, you prescribe to Seth Partnow’s theory that – far from killing the midrange game – the three-point revolution actually “hardened and shaped it into a sparkling diamond,” by opening up the floor for the kind of “defense-shaking, shot-making artistry” that we all love to see from our favorite NBA stars.
As Seth points out in his new book, The Midrange Theory, shot charts don’t tell the whole story of a play – they leave out important context about how the ball and the shooter arrived at the shot location and they hide the ingenuity and creativity that continue to drive NBA offenses. However, because Synergy Sports has logged the action that preceded each scoring chance in every NBA game since 2005, we can create shot charts for several different types of plays to recover some of this important contextual information about how shots are being created. With this information, we can ask what exactly has changed about the game? And find out what remains basically the same.
In this post, we are going to look at leaguewide jump-shot locations for 16 different types of plays during two different time periods: “then” (shots attempted during the four seasons from 2007-08 to 2010-11) and “now” (shots from 2017-18 to 2020-21). These are heat maps (like the ones you see in NBA.com’s “HEAT” view) which show the density of jump-shot locations along a color scale from white (lots of attempts in an area) to purple (fewer attempts). These charts do not show FG% or any other measure of efficiency. Moreover, the charts we are going to look at are showing jumpers only.
Let’s start by looking at locations for four different types of catch-and-shoot jumpers.

The most common type of jump shot in the NBA is a spot-up, catch-and-shoot jumper. Ten years ago, this type of look constituted about 18% of all shots and, during the past four seasons, the proportion remained pretty much the same, at around 17%. Even in the before times, spot-up catch-and-shoot jumpers were almost exclusively three-pointers, but if you look closely at the chart on the left you will notice some exceptions. Check out those purple blotches that used to stain the free-throw line (indicating a smattering of midrange spot-ups) and the way that the hot spots in the corners used to spread out along the baseline towards the basket (seeping into the midrange area). Overall, though, the pair of spot-up, catch-and-shoot panels look very similar. The current shot chart is like the airbrushed version of the former one where all the color that once bled inside the three-point line has been “cleaned up”.
Likewise, if a team gets out in transition and a pass goes to the wing for a catch-and-shoot jumper it’s highly likely that the shot will be a three-point attempt (same as it would have been ten years ago). Interestingly, catch-and-shoot transition jumpers go up from the wing more often now than they did ten years ago (there has been an 80% increase from “then” to “now”) but they still represent a relatively small percentage of total shot attempts (3%) compared to their half-court cousins. As we saw in the first row, the right panel for the second row (“now”) is once again a bit tidier inside the arc than the left panel (“then”).
The third set of charts – for pick-and-pop, catch-and-shoot jumpers – shows a more dramatic shift in shot locations. Ten years ago, if somebody like Kevin Garnett set a screen and popped out to the perimeter for a catch-and-shoot jumper, he was usually popping to an area just beyond the foul line or to one of the elbows or (less frequently) to a spot on the baseline about 15 feet out. It was rare for a big man to pick and then pop all the way out for a three. More recently, most pick-and-pop attempts have been from beyond the arc, with 18-footers routinely stretching into 24-footers. Note, there are still a few pick-and-poppers that prefer to shoot from around the free-throw line. While the locations have moved away from the hoop, the volume of pick-and-pop, catch-and-shoot jumpers has remained consistent over the years, holding steady at about 2% of all shots.
The last of the four catch-and-shoot rows is for trail jumpers in transition. Like transition jumpers from the wing, trail jumpers have increased in popularity a bit over the last ten years, but they still constitute only 1% of shots. Even ten years ago, most trail jumpers were three-pointers above the break with a few top-of-the-key two-pointers mixed in. Now, all these shots are threes.
If the shooter puts the ball on the floor, each of these four types of plays can also lead to an off-the-dribble jumper. Let’s look at the shot locations that result from those situations.

Ten years ago, if a player spotted up, caught a pass, and attacked a closeout off the dribble, he would have been “stepping in” to a jumper, that is, he would have been taking a dribble or two inside the arc to attempt an 18-footer. Occasionally, it might have been even three or four dribbles into the lane for a little pull-up. These step-ins were initiated from spot-up locations all around the arc – from the top, the wings, and the corners – leaving five hot spots dotting the midrange in our shot chart on the left. In the past, very few of these spot-up-turned-OTD jumpers were threes, but in more recent seasons, there has been an explosion of one-dribble three-pointers. Typically, during these plays, a defender rushed out towards the shooter, he pump faked, dribbled once, stepped sideways, and launched a three-pointer. The new mantra for coaches and trainers is “keep a three a three” and you can see the results in the recent shot locations for spot-up, off-the-dribble jumpers. The vestigial hot spots in the midrange are still there, although they are a little fuzzier than they were before. This type of shot made up 3% of all FGA in both of the time periods.
Ten years ago, when teams got out in transition and the ball reached the wing, shooters would occasionally step-in and take a midrange jumper. Increasingly, if a jump shooter dribbles in these situations he is taking a rhythm dribble without crossing the three-point line. Of course, players still attack the basket from the wing on fast breaks, but they very rarely stop halfway to shoot a jumper. Settling for a long-two early in the shot clock is a big no-no these days.
In the panel on the left side of the third row, you can see how nicely the pattern of pick-and-pop, off-the-dribble jumpers followed the pattern of pick-and-pop, catch-and-shoot jumpers that we saw before. Ten years ago, OTD shooters were basically taking one step and one dribble from a location where they popped to catch the ball (usually about 18 feet from the basket) into the free-throw line for a jumper. There was also a separate hot spot in the middle of the lane that marked a common location for two-dribble pull-ups. The panel on the right side of the third row looks very similar although we know from the previous charts that the pop locations are further out now – typically out beyond the three-point line. Like we saw with the spot-and-dribble jumpers some of the pick-pop-and-dribble jumpers are attempted from behind the arc now.
The final row reflects some of the same trends we saw in the three rows above it – ten years ago it was not uncommon to have a trail man catch the ball in transition, step in, and shoot a jumper from the foul line. Now, trail men are much less likely to step in. Even if they take a dribble to get their feet organized, they tend to stay outside the three-point line when shooting a jumper in transition. Of course, big men don’t shoot off the dribble in transition very often, so these situations make up less than 1% of shots.
Next up, let’s examine a shot category dominated by the league’s stariest shooters: the pull-up jumpers.

The second-most common type of jump shot in the NBA is a pull-up jumper by the ball handler in a pick-and-roll. Ten years ago, these shots constituted about 7% of the league’s FGA and, more recently, the proliferation of P&R actions has pushed that proportion up to 10%. Both panels (“then” and “now”) show a mix of two- and three-pointers but the balance has shifted over the last decade. Previously, it was common for the ball handler to drive around the pick and pull up at the free-throw line or at one of the elbows for a jumper. Increasingly, deadeye shooters like Damian Lillard will clear the pick with a single dribble or two and then pull from behind the three-point line. You can infer from these shifting shot-density patterns that the average location of high ball screens has also moved further away from the basket in the past ten years – giving shooters a chance to stay behind the three-point line. Still, this is an action that continues to generate a diverse mix of jumper locations especially for hyper-efficient midrange jump shooters like Chris Paul (as well as plenty of runners, floaters, and shots at the rim that are not shown here).
Nothing screams “I’m a star” quite like taking an iso pull-up. This is one of the situations where we are most likely to see the “defense-shaking, shot-making artistry” that Partnow described in his book. The uptick in P&R actions noted above has come at the expense of isolation, as the rate of pull-up jumpers created by isos has slumped over the last ten years from 4% to 2% of all shots. Still, there remains plenty of shaking and shimmying left to go around. Both panels of the second row (“then” and “now”) show that many of these iso pull-ups occur in the paint. More recently, dynamic long-range threats like James Harden have pushed the boundary of that iso artistry out to places beyond the arc.
Handoff actions have become more common in the NBA over the last ten years. The panels in the third row show plays where a shooter took the handoff and dribbled the ball before shooting a pull-up jumper – which now account for 2% of all shots. Ten years ago, these types of handoffs tended to send a shooter curling into the middle of the court for a pull-up jumper around the free-throw line. Back then, these shots were rarely threes – as you can see from the panel on the left – there is very little purple leaking into the area beyond the three-point line. However, more recently, it has become more common for shooters like Duncan Robinson to curl around a handoff 25-feet from the basket and dribble into a three-pointer. Still, there remains a variety of handoff locations inside and outside the arc – with an elite midrange shooter like Kevin Durant, for example, still often being set up for two-point chances. The common pattern in the first three rows of pull-up jumper charts is essentially that we still see some of the shots we saw before from these actions (P&R, iso, or handoffs), but now NBA offenses generate threes from these plays as well.
The final row shows a stark change in the shot locations of pull-up jumpers in transition. These are not shots that resulted from passes thrown ahead to the wing (which we looked at earlier) or from leak-outs (which is a separate transition category), these are situations where a player (think: Trae Young) dribbled the ball across half court and took a pull-up jumper without passing to a teammate. Interestingly, unlike the other types of transition jumpers, these no-pass pull-up jumpers have not grown much in popularity recently, they still constitute about 1% of FGA. What has changed, obviously, is the philosophy about where these shots should be attempted. Ten years ago, a transition ball handler might pull up from anywhere in the middle part of the court, whereas, in the last four seasons, transition pull-up jumpers have been concentrated much more densely around the top of the three-point arc, with just a faint trace of purple left at the elbow.
Finally, let’s check out shot locations that have resulted from four different types of off-ball screen: straight, flare, fade, and curl.

These are not huge shot categories (three of the four amounted to <1% of FGA both “then” and “now”). In fact, you may be accustomed to seeing off-ball screens displayed as a single consolidated play type on the Synergy website or on NBA.com; but it’s fun (and educational!) to break them out and look at the individual heat maps.
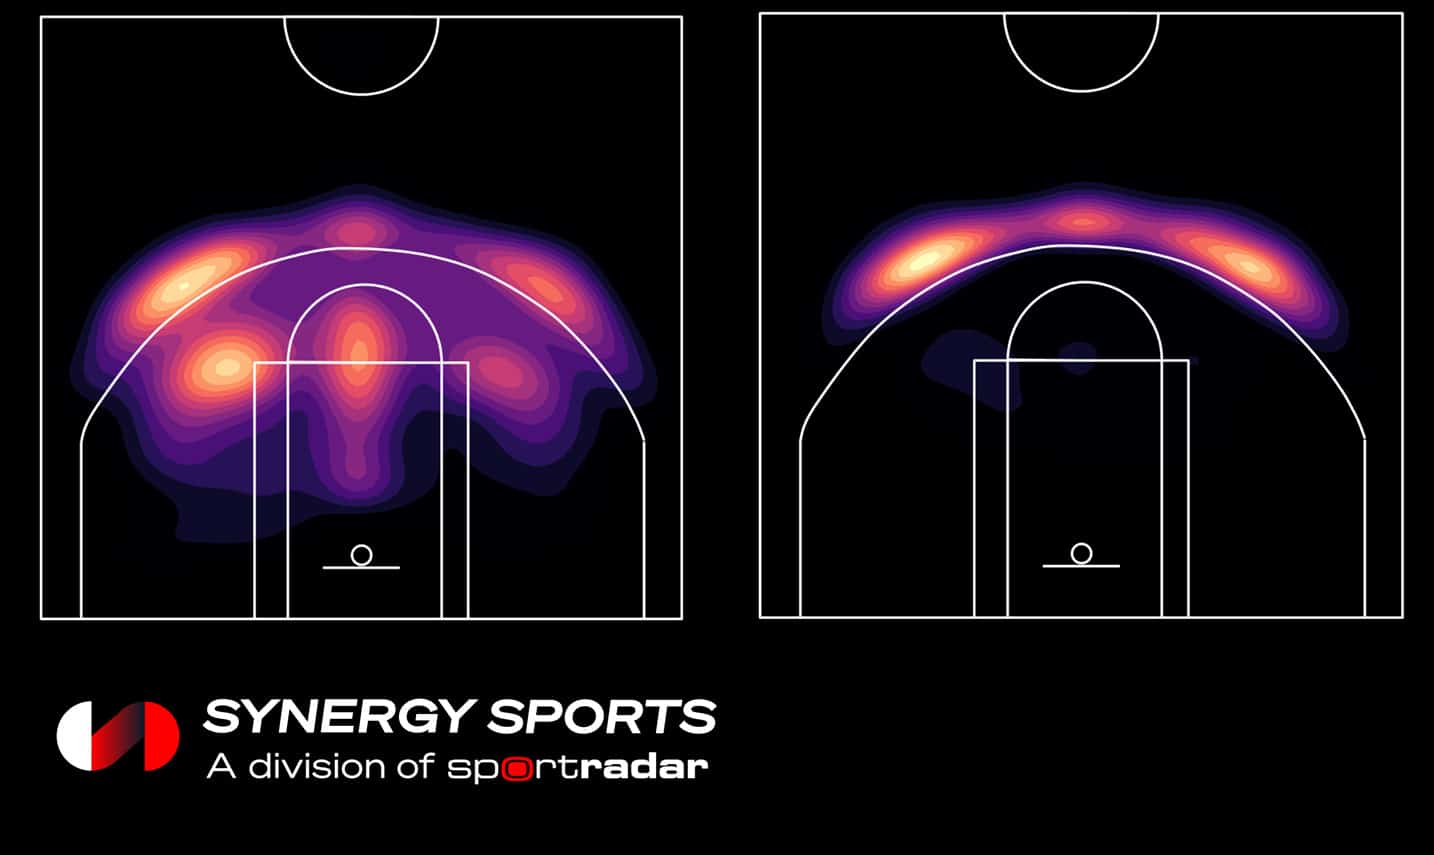
Ten years ago, these four types of screens created four distinct patterns of catch-and-shoot jumper locations. Straight screens tended to get shooters open on the wing, mostly for midrange catch-and-shoot jumpers; flare screens led mostly to above-the-break threes; fade screens generated long-twos and threes in the corners; and curl screens produced foul-line jumpers. The heat maps were not entirely mutually exclusive – there was some overlap between them – but you could almost imagine fitting the four colored patterns together like puzzle pieces. There were four different types of screens for four different spots on the court.
In the last four seasons, three of the maps – the ones for straight, flare, and fade screens – have started to converge into a more homogeneous, overlapping picture. At this point, they are all (to varying degrees) a mix of three-pointers from above-the-break and in the corners. And the curl screen – that one misfit screen that keeps setting up shooters for twos instead of threes – is becoming less common around the league, with catch-and-shoot jumpers from curls now accounting for <0.1% of all shots. Basically, the goal of off-ball screens in the modern NBA offense is predominantly to set up three-point looks.
This is what makes this final set of heat maps such a nice encapsulation of the way shot charts can hide information, as they tend to obscure the true diversity of offensive actions that still exists in the NBA. If you look at the top three shot charts on the right side, they all look pretty much the same, nothing but threes. However, each panel represents an action (straight, flare, or fade) that is functionally very distinct. The different types of screens are set in different locations, at different angles, in coordination with different types of complementary actions. The shot charts may look the same but if you watched the clips or saw how the actions were drawn up – you would see that the plays unfolded differently.
So, yes, the game has changed, and it will continue to change. But in many ways the game has also remained the same. Coaches and players still have all the same basic actions at their disposal and, even though there are more shots attempted from behind the three-point line now than there were ten years ago, there is no shortage of different ways to create those looks.
Todd is building tools to help coaches, scouts, and players find winning team strategies as part of Synergy’s Analytics and Insights Team. He creates inviting infographics, engaging charts and interactive displays that make data compelling and accessible. Follow him on Twitter @crumpledjumper.