


Todd Whitehead
August 9, 2022
Examining how often and how efficiently 47 different championship teams scored last season.
The Golden State Warriors, the Sydney Kings, the Seoul SK Knights…what do they all have in common? I mean, yeah, they’re all champions, of course (the clue was in the headline!). But do they have anything else in common? The various professional leagues around the world have produced hundreds of champions this season – does anything tie them together? Do they share any stylistic or strategic commonalities? If we examine the scoring traits of champs from all around the world, can we detect traces of the championship DNA that defines them? Well, let’s find out!
We calculated regular-season scoring rates for 800+ teams from 47 of the best professional leagues across 6 continents, from Columbia to Croatia. We focused on nine different types of plays: pick-and-roll passing and scoring, isolation passing and scoring, post-up passing and scoring, movement scoring (off-ball screens + handoffs), transition scoring, off-ball scoring (ie. everything but PNR, iso, or post), to-the-hoop scoring, pull-up jumper scoring, and catch-and-shoot 3-point scoring. We looked at how often each team tried to score with each type of play as well as their point-per-possession efficiency in each of these situations.
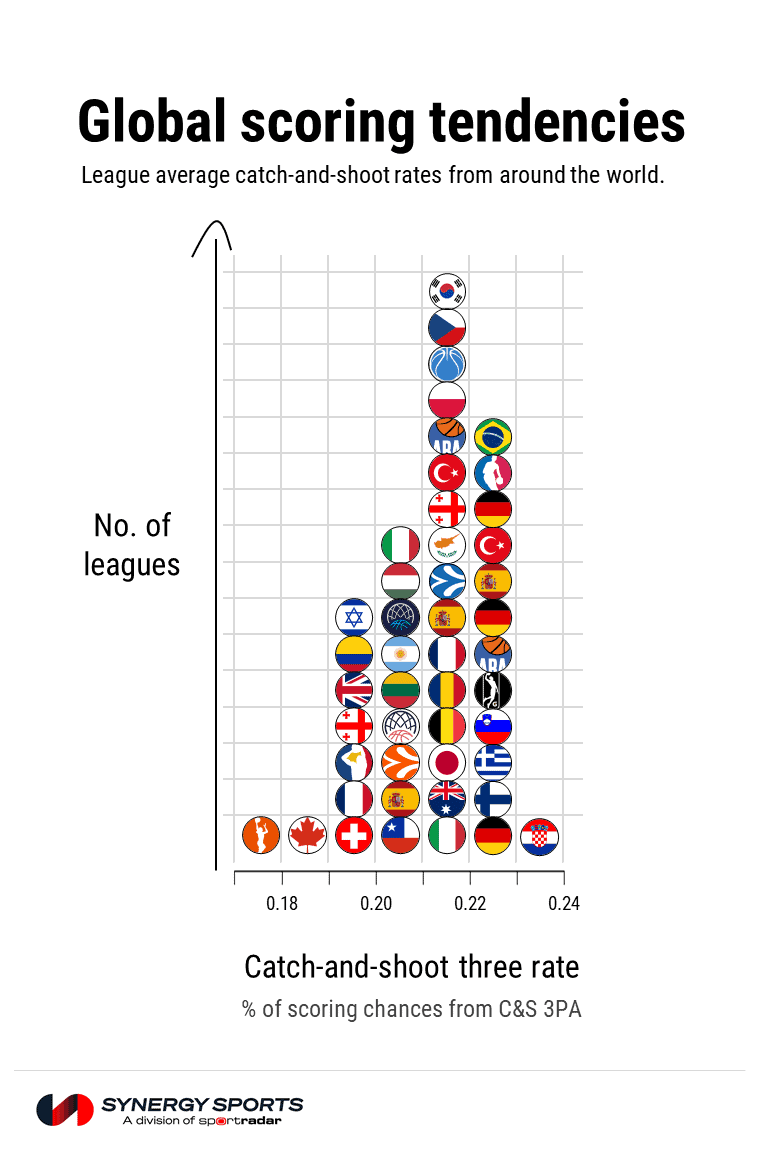
For example, here’s a look at how the average catch-and-shoot 3PA rates varied across the globe this year. The WNBA had the lowest rate and the NBA had one of the highest.
To compare championship tendencies between leagues, we’ll start by normalizing each team’s scoring rates using z-scores. In other words, we’re going to compare each scoring rate from each team to the corresponding league’s average rate. A z-score of +1, for example, would indicate a rate that was one standard deviation above league average (with about two-thirds of the rates falling between plus- and minus-one).
Check out the z-scores for the nine types of plays we analyzed – you can see the differences between champions (in orange) and all the other teams (in gray). Teams above the horizontal line scored at better-than-league-average rates and teams below the line scored at worse-than-league-average rates. Teams to the left of the vertical line tried to score less often than the average team in their leagues and teams to the right of the line tried to score more often than the league average.

The first observation that jumps out is that most of the orange dots are above the various horizontal lines, that is, championship teams tended to score with better-than-league-average efficiency. In fact, a dozen teams – including the Leicester Riders, Hapoel Unet Holon, and Olympiacos Pireaus – had above-average marks in each of the nine scoring categories. And the typical champion beat league average in 8 of 9 scoring rates. Sadly, “make more shots, win more rings” (accurate though it may be), is *not* exactly actionable strategic advice. So, instead of getting hung up on the top/bottom discrepancies we should perhaps focus on the left/right imbalances instead. What we want to know is – do championship teams attack the game in characteristic ways? The answer: maybe, a little.
Notably, championship teams were more likely to have below-average rates of pull-up jumper and isolation frequencies (more orange dots on the left side of the vertical lines in those two panels). On the other hand, championship teams were more likely to have above-average rates of catch-and-shoot 3PA (more orange dots on the right).
Just for funsies, we can take the average of the absolute values of z-scores across the nine scoring frequency categories to quantify which championship team played most distinctly from the other teams in their respective leagues. Who was the biggest oddball champ in the world this year? Turns out, the Warriors were the second-most unusual champ owning to their much-higher-than-average movement scoring frequency (+3) and their much-lower-than-average PNR frequency (-2). The only champ who stood out from the crowd even more than the Warriors was Alba Berlin, who leaned on their ability to push to score and rare combination of spacing, passing, and execution in the half court to capture the easycredit BBL crown.
Todd is building tools to help coaches, scouts, and players find winning team strategies as part of Synergy’s Analytics and Insights Team. He creates inviting infographics, engaging charts and interactive displays that make data compelling and accessible. Follow him on Twitter @crumpledjumper